No products in the cart.
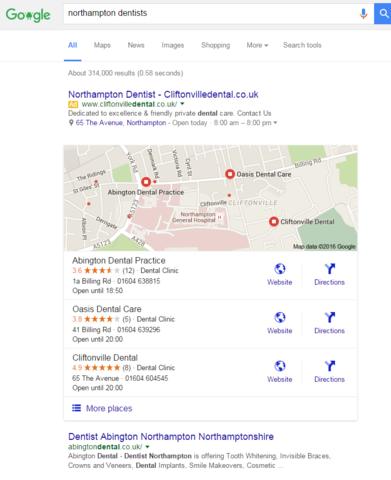
A few days ago I was sent an article that looked at the Google map pack and how many people actually click on this. The Google map pack usually resides at the top of a Google search listing.
Of course this is useful to understand and as this information is not usually available the company did it themselves. The following article is therefore an exert from Found Agency and the results they received from their analysis.
The first thing needed was to find some data to use. Accounts that had data on this tended to be ones where a physical location was particularly relevant, such as retail sites with physical stores, or the hospitality industry. This suggests there is a potential bias here. Putting that aside, it was discovered that one could easily find a number of accounts with search terms, impressions and clicks that could be used to estimate the click through rate. By the time this was finished, these accounts totalled over 3.6 million impressions in the last 12 months.
Search terms, impressions and clicks were downloaded for each company across mobile and desktop, which were then divided into brand and non-brand search terms. By finding all the variations of the client’s name, including an impressive number and array of misspellings, it was relatively easy to classify any term containing these phrases as brand terms. The click through rates for each client were calculated and averaged, totaling the average click through rates for each category.
HERE ARE THE RESULTS:
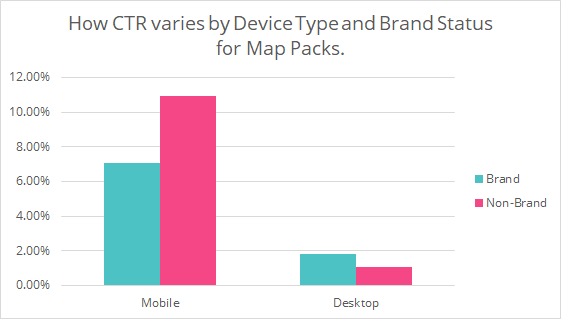
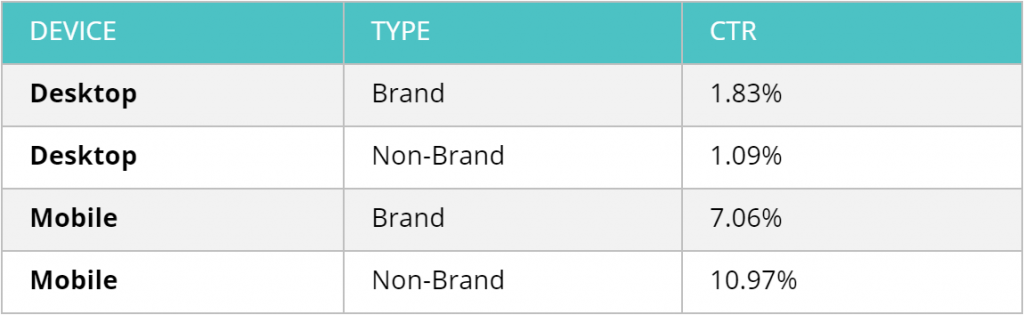
So, what does this mean?
Firstly, when it comes to map packs, the click through rate is dramatically higher on mobile than it is on desktop. This makes sense as people may be more likely to look for a location while on the go, and thus not near their desktop. Additionally, when searching for a location-based term on the phone, the map pack is the first item to appear within search results. However, when attempting the same search on desktop, the map pack appears under the main site – so it may be possible that users are simply looking for the quickest way to access the site.
Another interesting thing to note is that while on desktop brand terms have a higher click through rate, the opposite is true of mobile. In the case of desktop, brand terms may be more relevant as a person could be using this to find a specific location where they need to go before leaving their current location, which would likely favour a brand term with a specific location in mind.
Comparatively, mobile users may be making more impulsive decisions without a specific location in mind. The thought process here is as follows; if a person is already moving around and decides to search for something, this is less likely to be something they have been actively planning for a long time or they might have planned in advance and thus potentially have not thought far enough ahead to have a specific brand in mind. For example, if I get hungry while walking around, I probably haven’t had to time to decide that I specifically want Wagamamas. Most likely I want to find what food or, more specifically, what Japanese food is nearby.
The theory behind the reason why searches for brand on mobile are less likely to result in a click through to a website is because the user is already familiar with that brand, and Google is providing them all the information they need to find the location without clicking beyond the map pack, so the click out happens less often and therefore the CTR for the brand search is lower. This all sounds logical but, any explanation given for this is merely speculation.
I do think this analysis is worth understanding and therefore incorporating into our marketing plan moving forward. I will also keep my eyes peeled for future posts about the Knowledge graph and shopping adds!